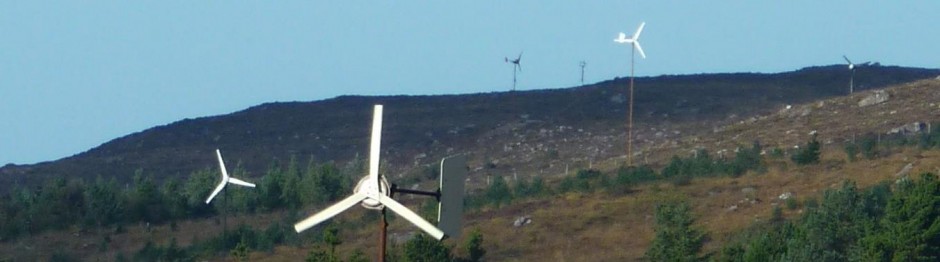
The bottom line with a wind turbine is how much energy it produces. Do not confuse this with the maximum power output! Rated power output is only achieved at rated windspeed, which will only occur from time to time. The energy produced depends on the average power and not the peak power. This in turn depends mostly on the turbine’s physical size (diameter) and the site average windspeed. Most of the energy will be produced while the turbine it generating less than its rated maximum power. In these everyday winds, the power depends on the size of the turbine, and not it’s power rating.
Here is a chart I did that estimates annual energy production for different sized turbines in different annual mean windspeeds. It is a bit pessimistic (turbines do exceed these predictions in many cases) but it shows the basic trends.
 Manufacturers will offer similar looking estimates of the energy production of their turbines in kWh per year assuming various different site average windspeeds. These figures can also be calculated, using the data for the wind turbine’s power output versus windspeed (the Power curve) and the data for how many hours per year the wind will blow at different windspeeds (the Windspeed Distribution – usually a “Weibull” Distribution rather than real data).
There are spreadsheets for doing this calculation available from various sources. http://bergey.com/ for example under “technical stuff” offer what they call WindCAD Performance Models for their turbines, based on their power curves and various site parameters including tower height etc.
 It can be fun to play aroud with this and see how various changes in input conditions affect the output energy. I like to add graphs/charts to help my understanding. Like this version: windcad hugh Be aware that this process is entirely subject to the quality of the input data. You can add your own power curves it you wish.
Site windspeed is defined in terms of the mean windspeed, and also a ‘Weibull k factor’ that describes the shape of the curve (pointed or broad). It’s very hard to predict the mean windspeed. Don’t rely on a simplistic post-code based prediction for this! It’s fair to assume that the k factor will be around (or just under) 2 for most good UK and US sites.
Better power curve data is one of the consequences of independent testing being done to achieve MCS in the UK and NREL testing in the USA. NREL actually publish the data on their web page.
Another site with a similar spreadsheet is http://www.windmonitor.de/ If you click on ‘English’ and look under ‘Service’ you will find a ‘yield estimation tool’.
The Carbon trust windspeed estimation tool for the UK allows you to enter power curve data, and thus estimate the energy production for your site. Unfortunately the tool is not particularly accurate but it can help you to understand the consequences of siting a turbine under a tree.

But if you prefer larger turbines you can use this link

Dear Hugh,
I am designing a wind farm near Cisadane River, Indonesia and the annual average wind speed is just 4.33 m/sec. The Enercon wind turbine 70/2300 has a cut in wind speed of 2 m/sec. Would this be sensible enough to design the wind farm at this site? My biggest concern is instantaneous power output at this low wind. I am also using HOMER Pro software for my simulation. I would like to seek your assistance, with whether I should go for a Horizontal axis turbine or a vertical axis turbine for this site or completely discard the wind farm installation. It is also to be noted that the project should at least achieve net zero carbon as floating PV is also integrated.
hi Olivia,
Yes if you do the simplistic multiplying by two trick then this is correct, but obviously not very precise. The reason why average power is more than the power at average windspeed is that the high winds offer much higher power due to the cube law. The resultant factor (average power/power at average windspeed) is known as the “energy pattern factor” and it is directly related to the Weibull factor k. I think that when k is 2 then the pattern factor is 1.8 and vice versa roughly. But all this is not really going to help you get a more accurate figure. In reality the shape of the turbine power curve is important as the curve will not continue up forever.
The way to get an accurate figure is to use a power curve for the turbine alongside a distribution for the windspeed (hours per year at each windspeed). Multiply them together to get the energy produced. That’s what the spreadsheets do, and they are simple enough to use. You should try them.
cheers
Hugh
Hi Hugh,
I am a university student working on a project and I need to determine the energy output of a turbine in in Winnipeg. I have found a turbine with a swept area of 1810m^2 and the average wind speed to be 5m/s, and a power coefficient of 0.45. I followed all of your above steps and got a MWh of 1092.5 however I am not sure if this is correct. Additionally, I do not understand why you multiply by 2. I know that it is the standard k of rayleigh distribution but I am not sure how that applies/connects to this calculation. I would really appreciate some help on this.
Monitor the energy production of a wind turbine with GREEN POWER METER : http://www.instructables.com/id/Green-power-live-data/
i have been trying for YEARS to calculate the amount of Kilowatt hours that
wind-powered alternators will produce in St. Paul MN in an average year.
If a vertical-axis ” eggbeater ” rotor is used that is 5 feet in diameter and
mounted 20 feet high, what would be its yearly output in Kilowatt HOURS?
The answer is VERY critical to the success of my new business:
CITYwind Harvesting Systems. Any clues or leads will help, too.
Thank you. Doug Tessling.
hi Doug,
The basic information you need is the swept area (in your case about 9 square metres assuming the blades are straight and 20 feet long vertically) and the annual mean windspeed. In the city the annual mean is likely to be about 3 metres/second whereas on a tall tower in a clear area you might get more like 6 m/s.
Average power output will be roughly about twice the instant power output at that windspeed (assuming that the wind varies according to the Rayleigh distribution aka k=2).
Instand power in theory is 1/2 x density of air (1.2) x area x windspeed cubed = .5 x 1.2 x 9 x 27 = 150 watts or so average (3 m/s wind)
But in reality you will only get 25% of this theoretical power with a real world turbine, so we can say 40 watts. Double this for the Rayleigh distribution effect, and we can say an average of 80 watts over 24 hour and 365 days makes 700 kWh per year. If you put it on a proper site on a proper tower with 6 m/s windspeed you could get maybe 8 times more than this around 5-6000 kWh per year.
Hugh