The wind widget on my front page was given me free by Logic Energy. It is fed with data from my house by a device called the LeNet. (I can access the data and make lots of interesting charts and csv files on a management site. ) You will probably have to pay to get your LeNet.
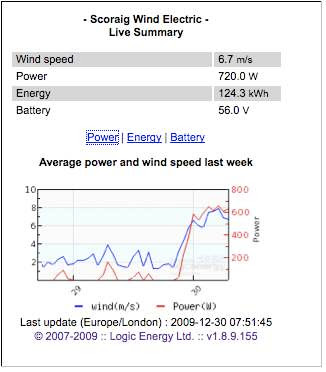
The widget shows both the windspeed and the power produced by my AWP wind turbine charging my 48 volt battery. Lately the windspeeds have been terrible (average 1-2m/s), but this morning the wind is picking up at last, and you can also see the power production picking up (in red). Power depends on the cube of the windspeed. When the wind gets stronger, (around 10 m/s) the AWP turbine starts to furl away from the wind speed and the power doesn’t increase any more. In fact it may go down (a bit) in very strong winds.
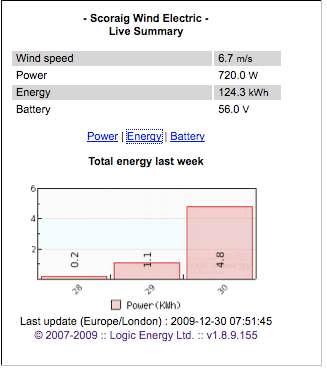
Click on the link called ‘Energy’ to see another chart – this time showing kWh of energy produced each day.
We use about 6 kWh of energy each day, and most of this is usually provided by the AWP. We also have a PV array (640 watts peak) that provides over 2 kWh per day on average, but at this time of year it hardly does anything because the sun just gets up and goes down in one swift movement (if it bothers to show up at all). This morning we have already had 4.8 kWh of wind energy before breakfast, which is great news after all the calm days.
If we don’t get enough energy to keep the battery healthy then we have to run a generator. If we get more energy than the battery can absorb then the surplus gets used to heat water.
We run the generator for about 150 hours each year. That produces 2-300kWh of energy per year. We dump about 4-500 kWh into hot water. If we had a big enough (huge!) battery then we would not need to run the generator, but batteries are not very environmentally friendly things, so this is a good compromise. I am building a bigger windmill so that we can use more electricity (dishwasher?) and not have to run the generator so much.
 Click on the word ‘Battery’ to see our battery voltage. We often glance at the battery voltmeter. If it gets low then I go around turning stuff off to save energy. If it gets high then we make an effort to use more electricity by washing clothes and stuff like that. If it gets down close to 48 volts then I start to make plans to run the generator. You can see a generator run yesterday on 29th and also on the day before when we got home from Edinburgh. The battery voltage goes up pretty fast when the generator is on but when it stops the voltage drops back down to around 50 volts again.
Today the wind is blowing, so the battery voltage is rising more gently, but because the wind puts in a lot more hours than the generator it does a much better job of charging the battery. If it gets up to 60 volts then the charge controller will kick in and start to make hot water, but I don’t expect a lot of that for a few days because the battery needs to get charged up first.
The calibration of my battery voltage sensing is not exactly perfect but near enough plus/minus 0.5 volts or less. In this cold weather the charge controller may well push the voltage up above 61 volts and it may drop down to 47 due to sluggish performance.
I hope this helps you make sense of the windspeed widget. I have plans to add wind direction when I get around to that. Meantime it must be breakfast time soon.


merci beaucoup
hi Huge
please, what is the diameter of this turbine? is it 3600 turbine?
thank you
hi habib,
the power figures given here are for a 3.6m diameter turbine but it is not one of the Recipe series “3600” models. It’s an older design that I did for manufacture in Zimbabwe twenty years ago. Actually it’s the smaller of two wind turbines that supply my house. the larger one is 5.4 metres diameter axial flux. A scaled up version of the recipe type. However it is not shown on this widget as it has only been in operation since 2013 whereas the datalogger with the widget is much older.
I also have a couple of kW of solar PV on the system and the energy consumption is typically around 15kWh per day with both wind turbines and all that solar. The widget only gives an incomplete view of the system.
I hope this helps.
Hugh
hi Huge
please, what is the diameter of this PMG?
Hi,
Looking for someone willing to work with me on my project. I offer monitoring module to track production of a wind turbine in your region. Is easy to install because it has current sensors noninvasive but requires internet connection at wind turbine location. There are already two locations monitored but I would like to add more. I look forward collaborators. Have a nice day, thank you!
http://free-energy-monitor.com/index.php/energy/live_data?tabela=data_log
Here is an live data monitor module for wund turbine and pv panels made with arduino:
http://free-energy-monitor.com/index.php/energy/energy_monitor
hi hugh
im just gettin started into all this but i plan on making my own vertical wind mill & adding solar planals as i go ive been reading your stuff on dump resisters & you talked shortly on heating water with some im curious why cant or dont you use an elect hot water heater as the dump thanx john
Hi John,
Yes of course you should use hot water as your first choice although there are some obstacles. It’s hard to find low voltage heaters. I use tpfay as my source. The thermostats don’t like high DC current and when they switch off you lose your dump. So I use transfer relays. Nowadays I often use relay drivers to operate AC ater heating (via the inverter) and the tristar is the “fall back” for after the water is hot.
See this page: http://scoraigwind.co.uk/relay-driver-for-load-management/
have fun, Hugh
Hi
Interesting:)
I like it
Good to get clear info.
That widget is cool