I wonder whether turbulence intensity vs direction would actually point out greater variability of higher speed winds. Lets see… Maybe turbulence intensity vs wind speed would do it…but then, we’d lose the directional data.
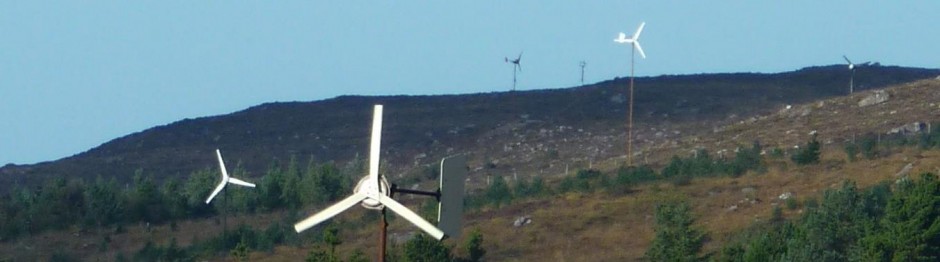
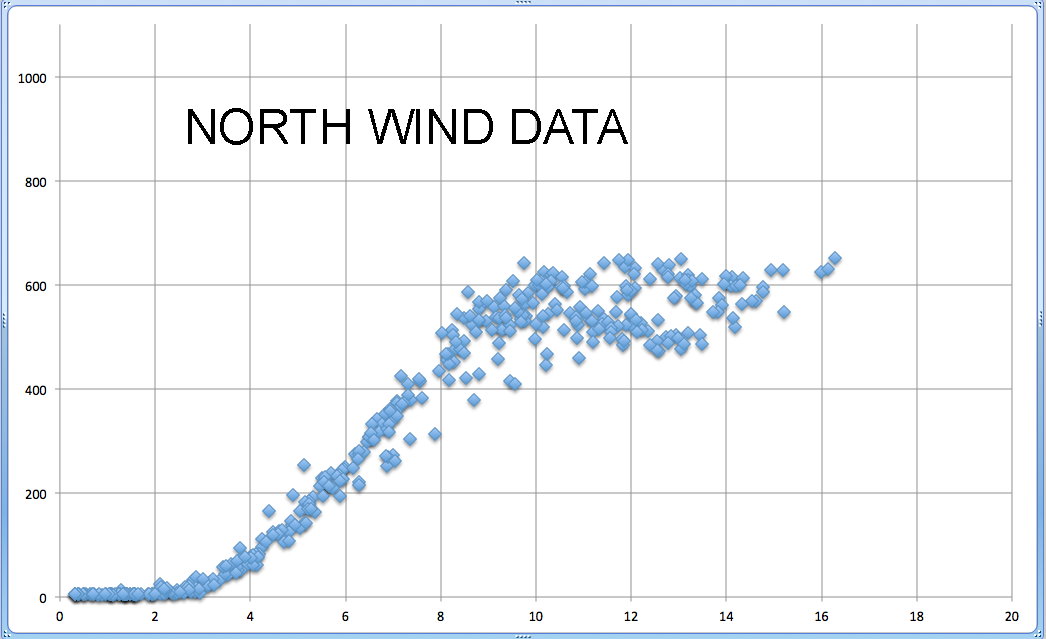
Looks as though the stronger winds from the North could be quite turbulent. The response of the data logger would be quick enough to record the wind speeds but the turbine probably doesn’t have enough time to accelerate before the peaks of some of the gusts subside.
It might be something like that, David. The south wind comes off the sea loch and up a steep slope past trees and houses to reach the turbine. The north wind comes over some low hills and could be more turbulent. They actually both seem pretty steady though. Or similar. I will check the standard deviation.
It would be quite interesting to compare the standard deviations of the winds from both directions. Could you plot standard deviation vs wind speed ?
It would also be interesting to examine how, or whether, the wind evens out with increased tower height. According to the research, that’s what we would expect.
Hi David,
I found the file with all the data and uploaded a chart of the turbulence intensity as a function of wind direction. There is no evident pattern to that. Turbulence intensity is the standard deviation/mean windspeed.
I wonder whether turbulence intensity vs direction would actually point out greater variability of higher speed winds. Lets see… Maybe turbulence intensity vs wind speed would do it…but then, we’d lose the directional data.
Looks as though the stronger winds from the North could be quite turbulent. The response of the data logger would be quick enough to record the wind speeds but the turbine probably doesn’t have enough time to accelerate before the peaks of some of the gusts subside.
It might be something like that, David. The south wind comes off the sea loch and up a steep slope past trees and houses to reach the turbine. The north wind comes over some low hills and could be more turbulent. They actually both seem pretty steady though. Or similar. I will check the standard deviation.
Hugh
It would be quite interesting to compare the standard deviations of the winds from both directions. Could you plot standard deviation vs wind speed ?
It would also be interesting to examine how, or whether, the wind evens out with increased tower height. According to the research, that’s what we would expect.
Hi David,
I found the file with all the data and uploaded a chart of the turbulence intensity as a function of wind direction. There is no evident pattern to that. Turbulence intensity is the standard deviation/mean windspeed.